September 30, 2011
Benchmarking Without Weightings: Like a Burger Without a Bun.
Hi everyone!
With the help of my colleagues I’ve been slowly but surely getting up and running a series of posts (here and here) about key technologies – to introduce them to the public, judge the reaction, and then gather ideas. But besides singing the praises here, I’d also like to give you my opinions on comparative tests – those that inform the public how efficient these technologies are. Alas, there are not that many tests I trust and can recommend.
There are just too many shortcomings in today’s testing methodologies, meaning the tests provide only a snapshot of the tested products and miss the whole picture. But it precisely the whole picture that is what customers need. Unfortunately, the majority of tests still employ old testing practices (like on-demand testing with outdated malware collections), which don’t reflect current real-life user scenarios.
And so now let me say a few words about PassMark. This is a very respected organization and I really admire the job it does. However, its recent anti-virus performance test has at least one significant flaw, which could mislead readers and cause them to make purchases based on faulty comparisons.
PassMark organizes benchmarking tests of different anti-virus products, or, to be more precise, it tests how much anti-virus slows down a standard system. In it’s the recent test the products of five companies that have already released 2012 versions – Avast!, G-Data, Kaspersky Lab, Panda, and Symantec – were compared.
The results put Symantec first, followed by Avast! coming second, and then us coming third. We won’t make any comments or judgments as to objectivity or impartiality of the testing, since PassMark doesn’t hide anything in this respect: the published results come with a disclaimer that states explicitly that the test was subsidized and conducted as per the methodology of one of the participants:
Symantec Corporation funded the production of this report and supplied some of the test scripts used for the tests.
What’s more interesting perhaps is that this disclaimer was present in PassMark’s previous anti-virus performance tests (2010, 2009, 2008). Can you guess who won all of them?
But still, a published test by a respected benchmarking organization is a published test by a respected benchmarking organization (and PassMark is one such organization). So despite the fine print – it still all looks good for the victor: it keeps banging on about the victory ad nauseam all over the place (only natural – who wouldn’t?), the public applauds the win, gets all excited, and of course is more likely to buy the product. I must say that it’d be very interesting to learn how exactly certain “supplied scripts” swung the voting to put the sponsor on the throne.
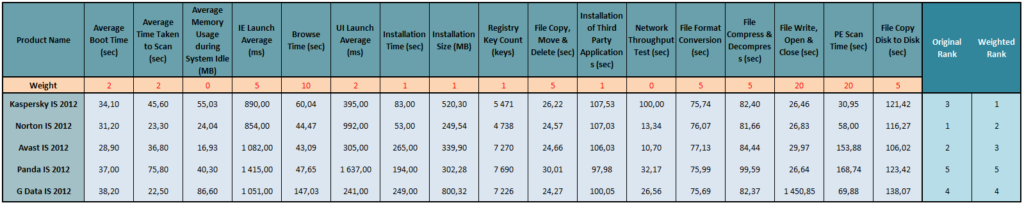
All you really need to do is look at this test a little closer to show it up for what it really is. The first thing you notice is that the points that can awarded for each of the tested parameters are of equal value; that is, a trivial parameter – if it’s good, gets the same number of points as a vitally important parameter that’s good.
Anyway, here is how the test was carried out. Every product is measured on 17 performance parameters (boot time, Internet Explorer launch time, file open and copying time, etc.). Then the products are ranked on the scores they get in each test, and then the rankings are summed up, and who gets the highest marks wins.
But, to reiterate, it is assumed that a user attaches equal importance to such parameters as “product installation time”(!), “speed of packing/unpacking archives”, “number of registry keys added”, and “network throughput”. But to me these parameters are in no way the same in importance! And I’ve no doubt you think the same.
So I decided to attach weightings, i.e., degrees of importance, to each measurement, and then look at the “corrected” results.
The weightings go like this:
- 0 – I think that the measurement is irrelevant to real world situations
- 1 – this action is performed very rarely, no more often than once a year
- 2 – this action is performed once or twice a week, no more
- 5 – an action performed once a day, maybe twice or three times at the most
- 10 – performed often
- 20 – performed very often or constantly – i.e., the most important actions
For a scenario based on my daily work we got the following:
- Test 1: Boot time. Not often used. Weight – 2
- Test 2: On-demand scan time. Rarely used. Weight – 2
- Test 3: Memory usage during system idle. I firmly believe anti-virus should re-schedule certain resource-intensive jobs for the PC’s idle time so as not to overload it during “war time”. Irrelevant metrics and measurement. Ergo, weight – 0.
- Test 4: Internet Explorer launch time. Weight – 5.
- Test 5: Internet Explorer browse time. If someone mouse-clicks incessantly without pause, not waiting until they’ve read the content, then of course the weight should be 20. For me, weight – 10.
And so on (see the table below). Ah, but just let me tell you about a few more tests, which need some explaining:
- Test 8: Installation size. Eh? How on earth does that affect real-life performance of the tested products? And for a better comparison the “size of data downloaded during installation” should be assessed too. But let’s let it be. Weight – 1.
- Test 9: Number of registry keys added. Well this is just hilarious. Perhaps they’d also like to count the number of files on the disk, or maybe the number of letters in the names of the files? Weight – 1.
- Test 12: Copy speed of files from the Internet (“network throughput test”). For some reason PassMark couldn’t measure our result for this. Then they sorted themselves out and would have been able to measure it, but by then it was too late. As a result the measurement turned out to be irrelevant. Weight – 0.
- Tests 15/16: File open, read and write, and PE-scan time. This is what’s most important! The performance of products should be judged based on this! Weight – 20.
- Test 17: File copy disk to disk. Since home products were being tested, I don’t see the relevance of this at all. Even if you had more than one local hard disk, why would you want to copy files from one disk to another? But whatever. Weight – 3.
Now, calculating the marks taking into account the new weightings – guess what? Yep, that’s right, the result’s not so good for Symantec (click on the image to see details).
But these results are of course based on my own personal preferences. Everyone has their own. The main thing to take away from the methodology analysis above is to know not to take as gospel everything you read about in tests – namely, their results. Especially the results of tests with unequivocal disclaimers.
And another thought: I reckon it’d be not such a bad idea to write an applet where users can attach their own weightings to each testing parameter depending on their everyday computer experience. They could receive their own personal, bespoke result for the anti-virus that’s best for them.
To be fair, I should note that it’s not only this test that suffers from the mentioned types of flaws. Alas, practically all benchmarking tests don’t bother with weightings, bunching apples and oranges, and pears and peaches – and bananas and hamsters – all together as being the same.
So how do you know what to believe, you may ask.
Who can authoritatively measure the quality of an anti-virus solution?
The answer is simple: there really isn’t a test like that – one that I could unambiguously recommend as the best indicator.
With one there’s a deficient methodology, with another it’s too specific, and so on. My advice is to check out a few of the possible options available and never rely on just one. Look at a few tests like those carried out by Andreas Marx’s AV-Test, Andreas Clementi’s AV-Comparatives, and Anti-Malware Test Lab, Virus Bulletin and Matousec, which aren’t run by Andreases.
That’s your lot for today. See yer!…

